
- Background
- Coastal Flood Mapping
- NL Atlas of Storm surge and Wave Climates
- NL Coastal Flood Simulation App
- NL Coastal Flood Hazard Tools (webinar presentation)
The estimated length of Newfoundland’s coastline is approximately 17,542 km, while the estimated length of Labrador’s coastline is approximately 7886 km. There are approximately 503 communities and over 300 small craft harbours dotted along the coastline of Newfoundland and Labrador. Approximately 35,500 people reside, and 24,000 structures or buildings are located within 60 m of the coastline in this province.
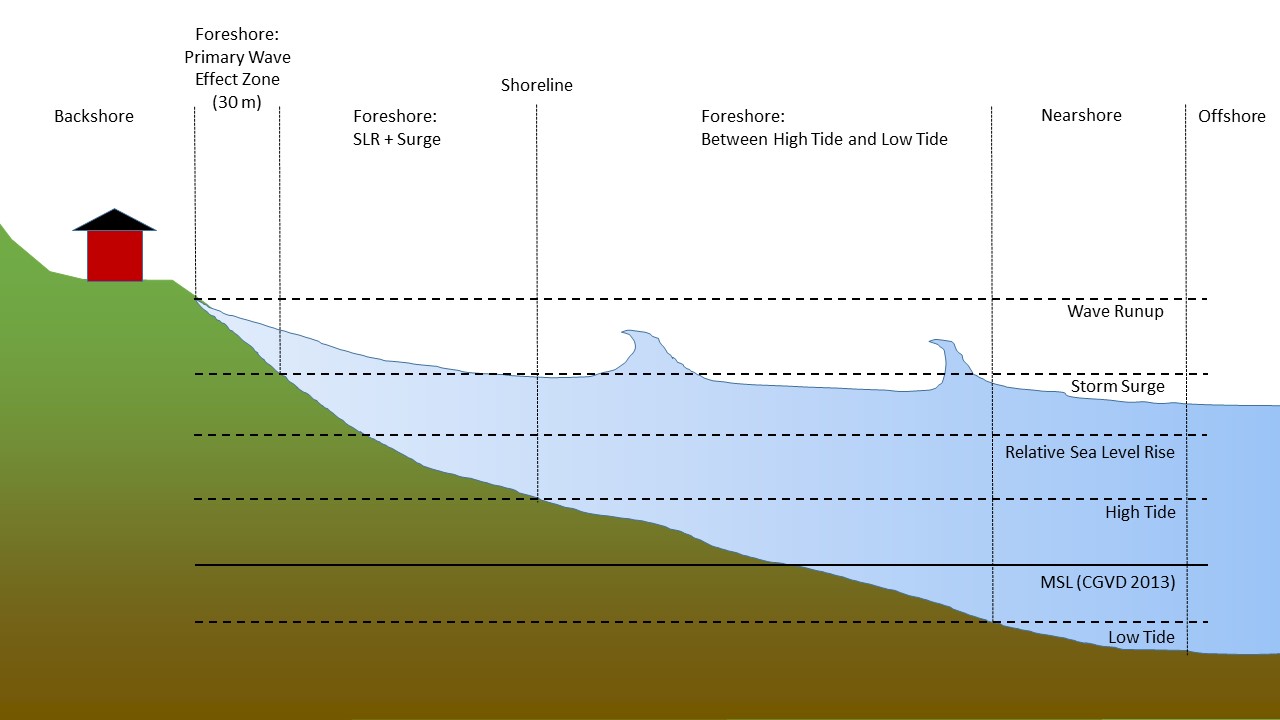
Sea level rise, storm surge and storm waves are expected to have a significant impact on coastal provinces like Newfoundland and Labrador. Sea level in parts of the province is expected to increase by 100 cm by 2100, projected future storm surge for parts of the province is expected to exceed 4 m, and the projected future storm wave climate for some parts of the province is expected to exceed 10 m. Coastal flooding processes of interest for hazard mapping include sea level rise, tides, storm surge and wave effects as indicated in the figure below.
Approximately 20% of flood events in the provincial flood event inventory are linked to coastal flooding. Hurricane Fiona demonstrated the vulnerability of coastal communities in Newfoundland and Labrador to coastal flooding hazard. Hurricane Fiona caused coastal flooding in 7 communities along the South West Coast of Newfoundland in September 2022 with damages estimated at over $100 million and counting.
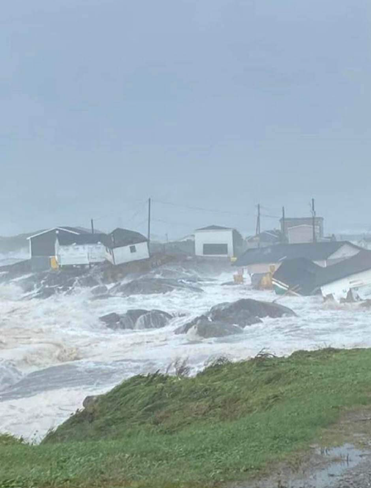
Coastal Flooding in Port aux Basques during Hurricane Fiona in Sept 2022
Newfoundland & Labrador Atlas of Storm Surge and Wave Climates
The Newfoundland & Labrador Atlas of Storm Surge and Wave Climates (hereafter referred as NL Atlas) is a comprehensive resource providing insight into the present and future patterns and characteristics of storm surges and waves along the province’s coastlines. At the core of the Atlas lies a set of advanced numerical models developed specifically for this initiative which cover the entire province’s coastline with spatial resolutions as fine as 1.5 km. These models have been validated against measurements taken at various points around Newfoundland demonstrating their capacity to represent the storm surges and waves in the area.
The Atlas is a valuable tool for researchers, decision-makers, and planners involved in coastal management, as it aids in understanding the potential risks and impacts of extreme weather events, allowing for informed decision-making and effective planning for flood risk mitigation.
The following links are maps and GIS files showing the locations for Extreme Value Analysis Results for reference.
The Atlas report and associated data are available for download below. Most data is available in both tabular and spatial formats.
- NL Atlas of Storm Surge and Wave Climates Report
- Extreme Value Analysis Results
- GIS Data – click here for a summary of the GIS datasets and statistical analyses produced for the Atlas.
Hindcast (1980-2022)
Climate Change Projections (2015-2100)
Hindcast and climate change time series data for storm surge and waves is available upon request to WRMD: waterinvestigations@gov.nl.ca
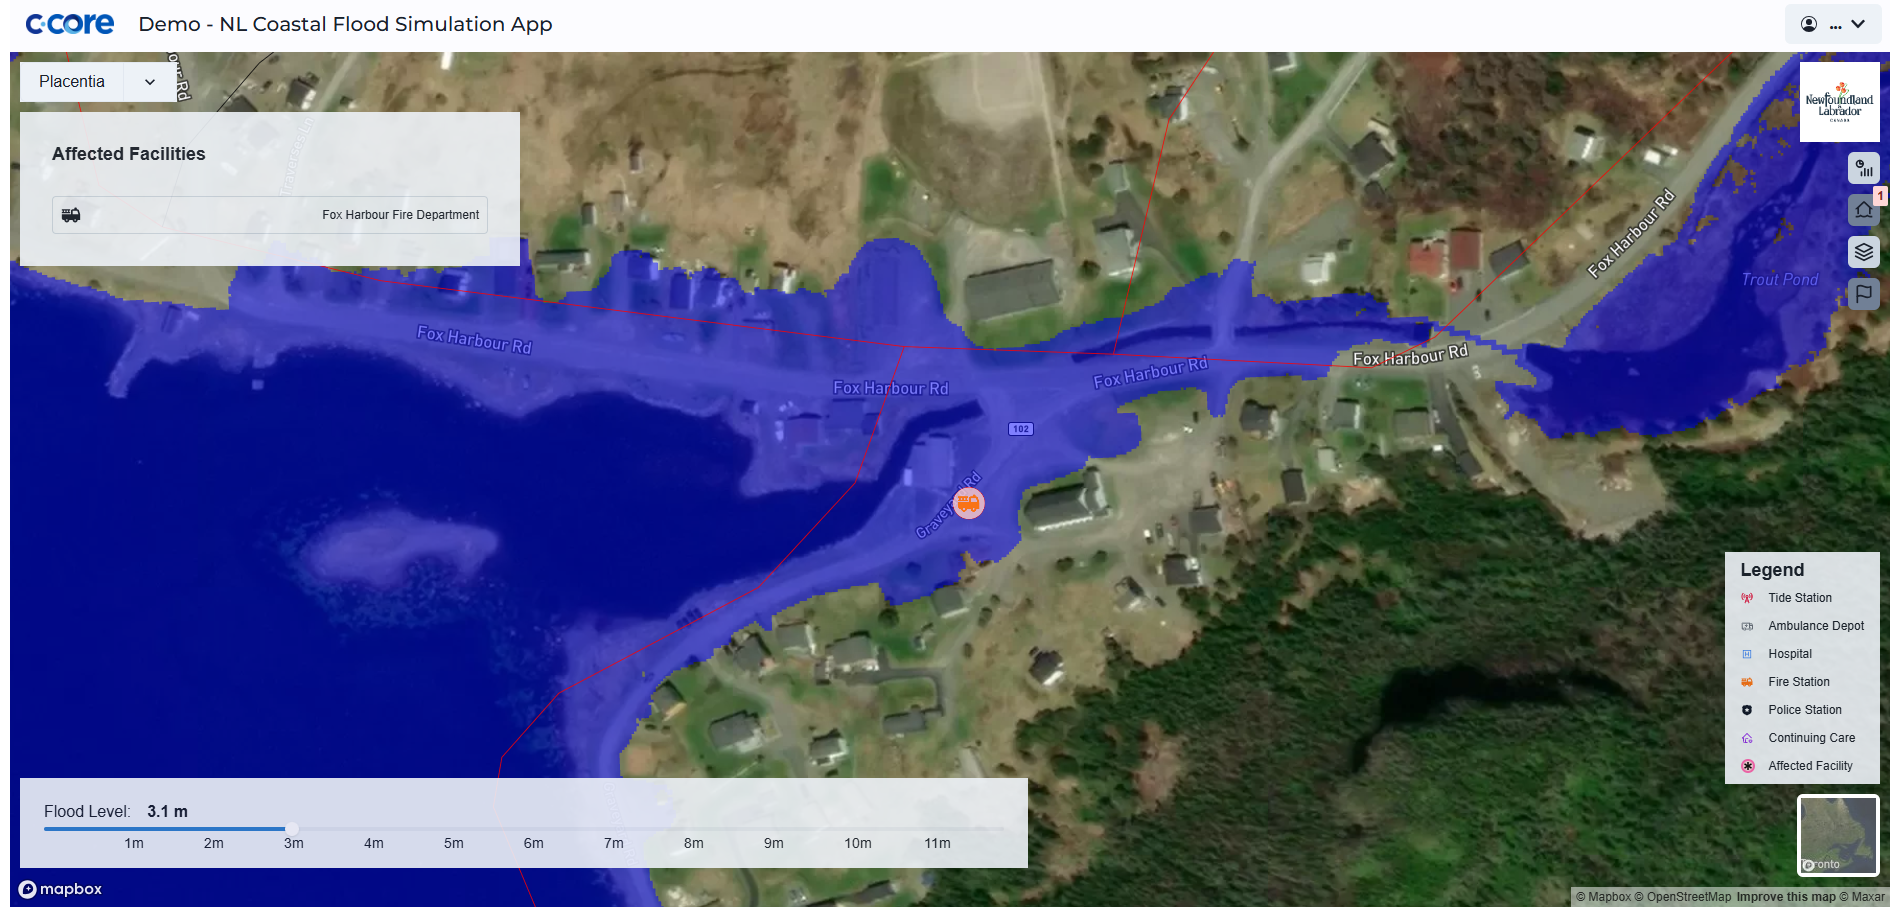
NL Coastal Flood Simulation App
Newfoundland and Labrador’s coastline is prone to coastal flooding due to storm surges and rising seas levels. The web-based NL Coastal Flood Simulation Application has been developed to provide a tool where users can visualize various flood level simulations along the coast of Newfoundland and Labrador. The app uses LiDAR derived high resolution digital elevation models (HRDEMs) with hydrological corrections to ensure proper hydrological connectivity, and generates flood depths and extents for flood levels at 10 cm intervals up to 12 m above sea level using the CGVD2013 vertical datum. The app uses a bathtub inundation model approach to simulate flooding while ensuring hydraulic connectivity. The app also shows active tidal stations, and critical infrastructure and roads that could be impacted by coastal flooding.
Click to see the NL Coastal Flood Simulation App.
As additional coastal LiDAR is collected, more locations will be added to the NL Coastal Flood Simulation App.
To learn more about how to use the NL Coastal Flood Simulation App, please see our User Guide or Tutorial Video on the WRMD YouTube channel.