

- Today’s Hurricane Season Flood Alerts
- Current Streamflow Conditions
- Hurricane Season Forecast and Post-Season Reports
- Hurricanes, Flood Damages and Climate Change
- The Hurricane Season Flood Alert System
Today’s Hurricane Season Flood Alerts
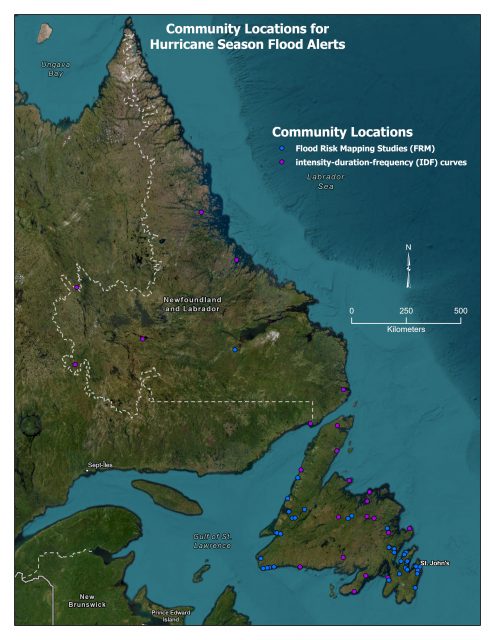
The Hurricane Season Flood Alert System (HSFAS) is based on forecasted precipitation amounts and seeks to provide communities with flood warning services as a key climate change adaptation and public safety tool. Alerts are provided to communities that have Flood Risk Mapping Studies (FRMS) or have published intensity-duration-frequency (IDF) curves from which precipitation based flood triggers can be derived. The HSFAS is to help communities in the province prepare for storms and avoid future high-cost expenditures in repairs and damages. The HSFAS is operational during the peak hurricane months of June to December. A list of the communities for which alerts are currently provided is shown below.
The report in the Adobe PDF file below has a table that is divided into two categories. These are:
- An alert for “Areas with Flood Risk Mapping and Precipitation Induced Flooding” indicates a potential of flooding based on our flood risk mapping studies. The flood alerts are based on FRMS. All of the studies and mapping for the 1:20 and 1:100 AEP flood events are available on our Department’s webpage: www.mae.gov.nl.ca/waterres/flooding/frm.html. The studies defined the 1:20 and 1:100 Annual Exceedance Probability (AEP) flood event and associated precipitation events.
- An alert for “Areas with EC IDFs but no Flood Risk Mapping” is based on the IDF curves from Environment Canada for that specific area. Consequently, it does not reflect any historical flooding but indicates a historically rare event.
Today’s Hurricane Season Flood Alert (260 KB)
Current Streamflow Conditions
Existing conditions on rivers and lakes can impact whether a precipitation event leads to flooding. If water levels are already high the chance of a precipitation event leading to flooding will be increased. The map in the link below represents current streamflow conditions. The colored dots on this map depict streamflow conditions as a percentile, which is computed from the period of record for the current day of the year. Only stations with at least 10 years of record are used. A percentile is a value on a scale of one hundred that indicates the percent of a distribution that is equal to or below it. For example, on the map of daily streamflow conditions a river discharge at the 90th percentile is equal to or greater than 90 percent of the discharge values recorded on this day of the year during all years that measurements have been made. In general:
- a percentile greater than 75 is considered above normal
- a percentile between 25 and 75 is considered normal
- a percentile less than 25 is considered below normal
Hurricane Season Forecast and Post-Season Reports
The NOAA’s 2024 Atlantic Hurricane Seasonal Outlook predicts an 85% chance of an above-normal season, followed by a 10% chance of a near-normal season and a 5% chance of a below-normal season. Both Colorado State and Tropical Storm Risk forecast Accumulated Cyclone Energy (ACE) which is aggregate measure of storm intensity, duration, and number. ACE biases toward long-lasting intense hurricanes rather than weak tropical storms because long-lasting intense hurricanes are more likely to cause destruction. Colorado State is predicting a seasonal ACE of 210, which is well above the 1991-2020 average of 123. Meanwhile, Tropical Storm Risk (TSR) is predicting a seasonal ACE of 217, also well above the 30-year climate normal..
The forecaster anticipates an above normal season for the province, with the greatest risk of tropical storms, hurricanes, and strong post-tropical storms across eastern Newfoundland, including St. John’s. These types of storms carry the associated risk of high wind gusts of more than 100 km/h, heavy rain of more than 100 mm with associated flooding, and storm surge flooding on exposed coastline near sea level..
Detailed Documents
- 2025
- 2024
- 2023
- 2022
- 2021
- 2020
- 2019
- 2018
- 2017
- 2016
- 2015
- 2014
Hurricanes, Flood Damages and Climate Change
Flooding is a natural event, but often has devastating effects on our lives and properties. These can be minimized by proper planning, state-of-the-art flood forecasting and flood alert systems and appropriate flood control strategies.
In Newfoundland and Labrador, floods in the fall of the year are the most costly in terms of flood damages.
Below is a graph with a seasonal breakdown of Disaster Financial Assistance Arrangements (DFAA) Damage Estimates. As illustrated, Fall events result in the greatest dollar value flood damages.
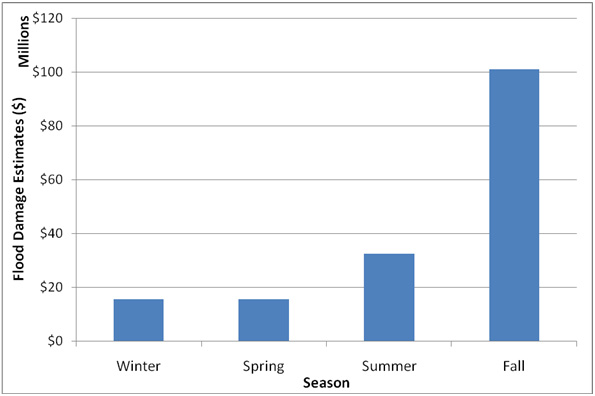
| Season | Flood Damage Estimates ($) |
|---|---|
| Winter | $15,530,308 |
| Summer | $15,589,602 |
| Spring | $32,388,278 |
| Fall | $101,014,638 |
Flooding in the fall is typically caused by weather systems that originate as hurricanes. The damage path from hurricane based weather systems is typically widespread as was observed for Hurricane Igor in 2010.
Floods, public safety and climate change are integrally linked. Due to climate change, the frequency and intensity of extreme precipitation events such as hurricanes that result in flooding is expected to increase. Climate change altered precipitation patterns will result in new communities experiencing regular floods and communities with existing flooding issues experiencing more intense and extensive flooding incidents.
The Hurricane Season Flood Alert System
The Hurricane Season Flood Alert System (HSFAS) is based on forecasted precipitation amounts and seeks to provide communities with flood warning services as a key climate change adaptation and public safety tool.
Alerts are provided to communities that have Flood Risk Mapping Studies (FRMS) or have published intensity-duration-frequency (IDF) curves from which precipitation based flood triggers can be derived. The HSFAS is to help communities in the province prepare for storms and avoid future high-cost expenditures in repairs and damages.
The HSFAS is operational during the peak hurricane months of June to December.
The communities for which alerts are currently provided are listed in the Table below and depicted in the following map.
Communities / Areas with Precipitation Triggers for Hurricane Season Flood Alerts
| Precipitation-based flood triggers | 1:20 (mm) | 1:100 (mm) | |||
|---|---|---|---|---|---|
| # | Community (Area) | 12h | 24h | 12h | 24h |
| FRMS | |||||
| 1 | Appleton/Glenwood | 65 | 85 | 81 | 108 |
| 2 | Bay Roberts | 76 | 90 | 108 | 132 |
| 3 | Bishops Falls | 69 | 88 | 92 | 120 |
| 4 | Brigus | 98 | 110 | 124 | 137 |
| 5 | Burnt Islands | 85 | 113 | 104 | 142 |
| 6 | Carbonear | 98 | 110 | 124 | 137 |
| 7 | Channel-Port aux Basques | 85 | 113 | 104 | 142 |
| 8 | Clarenville | 97 | 109 | 128 | 143 |
| 9 | Corner Brook | 54 | 66 | 62 | 76 |
| 10 | Cox’s Cove | 54 | 72 | 66 | 89 |
| 11 | Deer Lake | 56 | 70 | 69 | 87 |
| 12 | Ferryland | 98 | 110 | 124 | 137 |
| 13 | Glovertown | 74 | 88 | 95 | 113 |
| 14 | Grand Falls-Windsor | 69 | 92 | 88 | 120 |
| 15 | Great Codroy (Codroy Valley) | 85 | 113 | 104 | 142 |
| 16 | Hant’s Harbour | 98 | 110 | 124 | 137 |
| 17 | Happy Valley-Goose Bay | 50 | 62 | 62 | 75 |
| 18 | Heart’s Delight-Islington | 98 | 110 | 124 | 137 |
| 19 | Hickman’s Harbour | 96 | 109 | 127 | 142 |
| 20 | Hodges Cove | 102 | 115 | 135 | 151 |
| 21 | Isle aux Morts | 85 | 113 | 104 | 142 |
| 22 | Kippens | 78 | 101 | 100 | 127 |
| 23 | Logy Bay-Middle Cove-Outer Cove | 96 | 110 | 121 | 137 |
| 24 | Mount Pearl, St. John’s | 106 | 102 | 135 | 149 |
| 25 | Parsons Pond | 72 | 98 | 91 | 125 |
| 26 | Petty Harbour, St. John’s (Goulds) | 96 | 110 | 121 | 137 |
| 27 | Placentia | 127 | 114 | 173 | 194 |
| 28 | Portugal Cove-St. Philip’s | 96 | 110 | 121 | 137 |
| 29 | Rose Blanche | 85 | 113 | 104 | 142 |
| 30 | Rushoon | 97 | 119 | 125 | 154 |
| 31 | Salmon Cove | 98 | 110 | 124 | 137 |
| 32 | Steady Brook | 56 | 70 | 69 | 87 |
| 33 | Stephenville | 78 | 101 | 100 | 127 |
| 34 | Stephenville Crossing | 79 | 102 | 105 | 136 |
| 35 | Trout River | 72 | 98 | 91 | 125 |
| 36 | Victoria | 98 | 110 | 124 | 137 |
| 37 | Whitbourne | 104 | 117 | 138 | 153 |
| 38 | Winterton | 98 | 110 | 124 | 137 |
| IDF |
|||||
| 1 | Argentia (Argentia Auto) | 134 | 152 | 183 | 204 |
| 2 | Badger | 81 | 98 | 104 | 126 |
| 3 | Blanc Sablon, L’Anse au Clair | 59 | 73 | 73 | 90 |
| 4 | Bonavista | 117 | 113 | 160 | 181 |
| 5 | Burgeo | 89 | 104 | 106 | 124 |
| 6 | Churchill Falls | 44 | 54 | 54 | 66 |
| 7 | Comfort Cove | 63 | 74 | 79 | 93 |
| 8 | Daniel’s Harbour | 69 | 98 | 87 | 126 |
| 9 | Englee | 104 | 130 | 137 | 172 |
| 10 | Gander | 65 | 85 | 81 | 108 |
| 11 | Hopedale | 44 | 60 | 56 | 76 |
| 12 | La Scie | 65 | 80 | 81 | 97 |
| 13 | Mary’s Harbour | 56 | 70 | 71 | 88 |
| 14 | Nain | 51 | 63 | 63 | 77 |
| 15 | Shefferville | 49 | 67 | 62 | 86 |
| 16 | St. Alban’s | 93 | 137 | 111 | 173 |
| 17 | St. Anthony | 60 | 77 | 74 | 96 |
| 18 | St. Lawrence | 101 | 130 | 127 | 167 |
| 19 | Terra Nova National Park | 83 | 96 | 105 | 122 |
| 20 | Twillingate | 57 | 71 | 69 | 87 |
| 21 | Wabush | 43 | 54 | 53 | 67 |
The HSFAS Alerts are based on site specific weather forecasts that are generated by the forecaster as a result of examining many of the available models from Environment Canada, the US National Oceanic and Atmospheric Administration, and the forecaster’s in-house implementation of the Weather and Research Forecast model. Examining maximum precipitation predictions from many different dynamic models allows the forecaster to produce a better forecast of the maximum precipitation potential based on the strength of different models in handling the atmospheric physics of differing weather patterns. Furthermore, the forecaster also examines the various model precipitation outputs within a given radius of each community/area. This allows the forecaster to identify potential flood situations where a particular model may have accurately modeled precipitation amount or identified a flood situation but erred in the placement of its location.
These site specific precipitation forecasts are then directly linked to each site’s past flooding history through precipitation triggers. The precipitation triggers are derived from flood risk mapping studies and IDF curves. These precipitation triggers are summarized in Table 1.
The Water Resources Management Division correlates the HSFAS Alerts from the forecaster with water flow rates in the province’s river systems. This information is sent to Emergency Services Division who then alert the affected communities and coordinate responses
Adobe® Acrobat® Reader software can be used for viewing PDF documents. Download Acrobat® Reader for free.